
Static Sheer Testing
Static shear testing allows the engineer to measure the tape’s ability to maintain a bond under a constant load that is applied parallel to the tape’s surface. In the real world, think of a vertical panel that is bonded to a frame and you now have that constant load acting on the tape. Now let’s make it more relevant by placing the test specimens in a chamber and ramping the temperature from 0˚C to 100˚C. The test method used is ASTM D3654 and the overlap area is 1 square inch with a 1 Kg weight applied. The data table below shows the maximum temperature reached where the tape system failed cohesively before reaching a minimum of 10,000 minutes (approximately 7 days)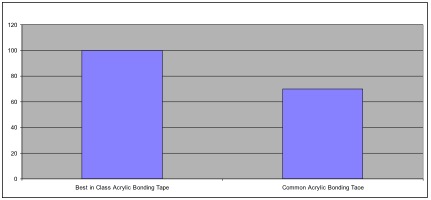
Dynamic Shear Adhesion
Like the static shear test, dynamic shear testing is typically conducted in a controlled lab environment. There is nothing wrong with that and the data is quite reliable. However, exposing the test specimens to a set of more extreme conditions is very useful to an engineer wondering what happens to a tape bonded seam or lap joint during thermal expansion and contraction or from sudden unforeseen forces such as gusting winds. ASTM D1002 is the commonly accepted dynamic shear test method using a 1”x 1” overlap on stainless steel panels. The lap joints were ramped from room temperature to 85˚C and 85% RH for 20 hours and then for the final 4 hours of the cycle, the temperature was lowered back to room temperature and then to -40˚C for 30 minutes and then ramped back up to room temperature. This cycle is then repeated 10 times. The specimens are then placed in a tensile tester, pulled apart, and the values recorded. The temperature ramp up and down is a great replication of thermal expansion and contraction common in tape bonded frames and panel members. The viscoelastic nature of tape is what allows it to distribute the stress along the bond line without overstressing the bonded substrates. After 10 of these cycles, here’s the kind of data you will see (values in pounds per square inch):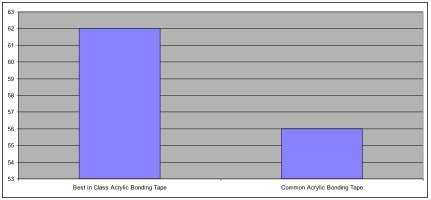 Want to learn more about tape bonding for truck and utility trailer applications? Contact Tom Brown, Inc.