When you’ve been in any type of business for a long time, you sometimes realize how much you take for granted or assume that other people know or understand. That hit me the other day when I was reviewing tape technical data sheets from two different manufacturers and realized that the data listed might not be easily understood by someone who isn’t in the tape business.
Here are some of the common test methods and data listed in many tape technical data sheets and some guidance on how to apply that information to your application.
Peel Adhesion
This is the most frequently cited test on any tape data sheet. In simple terms, it is the force per unit width required to remove a tape from a surface when removed at a specific angle (usually 90°or 180°) at a standard rate and condition. The data is normally reported in ounces or pounds per inch width or the metric equivalent of Newtons per 25mm.
The vast majority of reported peel data utilizes a stainless steel test panel. This is the industry standard test surface and it is useful in making an “apples to apples” comparison of one tape to another. Some tapes are designed for specific surfaces such as aluminum, glass, or low surface energy plastics. This data is considerably more useful in determining suitability for specific applications and some manufacturers will run peel tests on customer specific materials (even better!).
Two other pieces of information that will sometimes appear in peel testing data is dwell time and temperature. Dwell time is the amount of time the tape is allowed to dwell or “wet out” on the surface before it is removed. Most adhesive tapes reach their maximum peel strength in 24-72 hours. Some tapes are designed to provide fast wet out and shorter dwell times (immediate or 5 minute dwell times) might appear on the data sheet to provide insight on the strength versus dwell time.
Temperature may also play a factor in some applications and a peel value at an elevated temperature might be provided if peel forces will be encountered during end use.
Thickness
This value is pretty straightforward. Most manufacturers report the total thickness of their tapes. Two things to keep in mind are that most adhesive coatings and carriers or tape backings have a tolerance; +/- 10% is common so factor that in when looking at this data. The other thing to keep in mind is with double coated tapes, the release liner is removed so you have to subtract that thickness. Values are often reported in mils (thousandths of an inch), millimeters, or microns.
Tack
Tack is the property of the adhesive that allows it to wet out on a surface very rapidly (less than 1 second) under minimal pressure. This type of data is not as commonly reported on a data sheet but it is helpful to understand it if you see it.
Tack is usually measured in two ways- rolling ball tack or loop tack. In a rolling ball test, a ball bearing is released from a 30°inclined plane onto a strip of tape and the stopping distance is measured in inches or centimeters. The shorter the stopping distance, the tackier the adhesive system.
A loop tack test involves created a “loop” of tape and lowering the loop onto a stainless steel test panel and immediately pulling it away. The force to remove the tape is recorded in ounces per inch or Newton per 25mm.

Shear
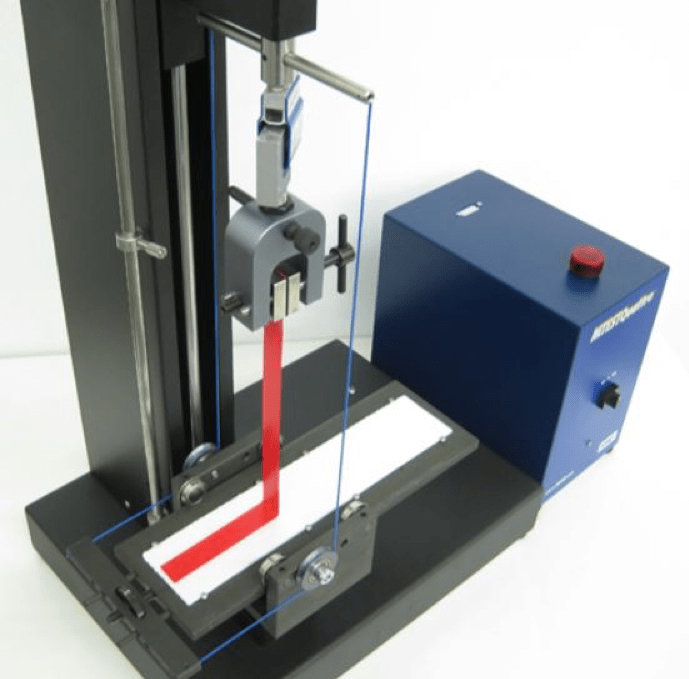
Shear resistance or shear strength is the ability of the tape to resist a force applied in the same plane as the tape. It allows you to get an idea of the internal strength of the tape under load. This property can be measured in a static mode (applying a weight and recording time to failure) or in a dynamic mode where the test specimen is placed in the jaws of tensile testing machine and pulled apart at a specified rate.

It is important to understand that a static shear test and a dynamic shear test provide different performance information. A static load provides steady force over a long time period. Think of a plastic hook that you might affix to a wall to hang a picture frame. The frame provides a steady shear force on the tape. The tape’s ability to resist this slow movement is what keeps the picture frame hanging.
A dynamic shear test provides a very different insight. A dynamic shear value (typically reported in pounds per square inch or kilopascals) provides insight into how a tape can resist a sudden shear force. An easy way to envision this is to think of a truck or utility trailer that has the side panels bonded to the framing system. A sudden wind gust or a shock of hitting a pothole in the road puts a strain on the tape that is short lived but very intense. It is common to see dynamic shear values on a data sheet for high performance bonding tapes such as 3M’s VHB acrylic foam tapes and similar competitive products.
Tensile Data

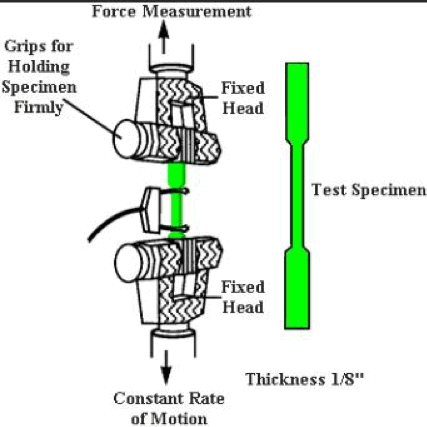
Tensile data can be reported in two ways depending on the tape being tested. For single faced tapes- particularly self-wound tapes such as duct tapes, masking tapes, electrical tapes, etc…, a tensile test is performed in a tensile testing machine where a specimen (usually 1” wide) is placed into the jaws and pulled apart at a specified rate. This data is typically reported in pounds per inch or Newtons per 25mm and provides useful insight into the strength of the backing material.
Tensile data can have a direct bearing on a tape’s ability to do certain jobs such as bundling where you might want to wrap or secure a number of things together. If the objects are heavy, you will typically need a tape with a higher tensile strength to keep the bundle intact without breaking.
You will often see elongation data presented along with the tensile test data. The elongation is a measurement of the increase in dimension expressed as a percentage before the actual breaking point. Having a tape with the ability to stretch or elongate is useful in certain application her the tape will need to bend around complex shapes or geometries without breaking.
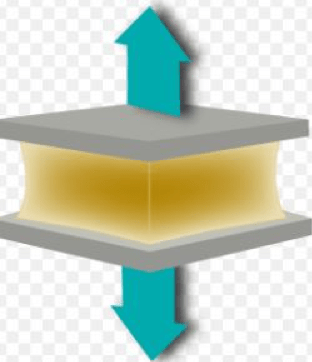
The second type of tensile data is often referred to as ‘Z Tensile” or “Normal Tensile”. This type of data usually appears on data sheets for high performance foam bonding tapes.

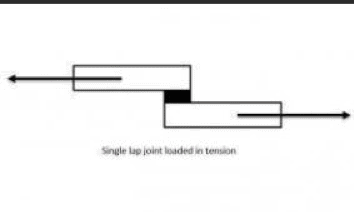
In this type of test, two test blocks usually made from stainless steel or aluminum are bonded together with the tape and allowed to dwell for 72 hours. The blocks are mounted into a tensile testing machine and pulled apart a specified rate. The force to pull them apart is recorded and measured in pounds per square inch or kilopascals.
These values can be useful in understanding how well a tape can resist being pulled off of a surface. Think of the body side molding or emblems on a car. You wouldn’t want to be able to grab the emblem and just “pop” it off of the car. This data gives you some insight into the force required to do that.
Temperature Resistance
Tapes aren’t always used in a home or office environment. Many of them are used outdoors or in manufacturing processes where elevated temperatures or maybe very low temperatures will be encountered.
Many manufacturers simply give you the range from low to high that the tape can handle without de-bonding. (i.e. 20°F- 150°F).
In other cases, manufacturers might report temperature resistance as “short term” and “long term”. The short term value is the maximum temperature the tape can handle for a duration of minutes or hours while long term is weeks or months.
Application Temperature
This data is different from overall temperature resistance. In a perfect world, all tapes would be applied to the intended surface(s) at 70°F +/- 5° but that is not always the case.
Some tapes are applied on construction sites or manufacturing facilities where the temperatures might be considerably lower or higher. The application temperature range gives you the insight into the adhesive’s ability to effectively create a bond. This range is usually much smaller than the overall temperature resistance once a good bond has been made.
Density
Density only appears on data sheets for foam tape products. The data is reported in pounds per cubic foot or kilograms per cubic meter. Foams commonly used in tape products include polyethylene, acrylic, polyurethane, and PVC. Even within those chemical families, the densities from one product to another can be different.
The important thing to understand is that a higher density value is not always better. In some applications a higher density foam might be very important while in other applications, it could be detrimental.
Need Help with your Tape Technical Data Sheet?
There can be other specialized data that might appear on technical data sheet but these tests are the most commonly reported for most products. If you have any questions about how to interpret any data sheet,
contact Tom Brown, Inc. and we’ll be happy to assist you

 It is important to understand that a static shear test and a dynamic shear test provide different performance information. A static load provides steady force over a long time period. Think of a plastic hook that you might affix to a wall to hang a picture frame. The frame provides a steady shear force on the tape. The tape’s ability to resist this slow movement is what keeps the picture frame hanging.
A dynamic shear test provides a very different insight. A dynamic shear value (typically reported in pounds per square inch or kilopascals) provides insight into how a tape can resist a sudden shear force. An easy way to envision this is to think of a truck or utility trailer that has the side panels bonded to the framing system. A sudden wind gust or a shock of hitting a pothole in the road puts a strain on the tape that is short lived but very intense. It is common to see dynamic shear values on a data sheet for high performance bonding tapes such as 3M’s VHB acrylic foam tapes and similar competitive products.
It is important to understand that a static shear test and a dynamic shear test provide different performance information. A static load provides steady force over a long time period. Think of a plastic hook that you might affix to a wall to hang a picture frame. The frame provides a steady shear force on the tape. The tape’s ability to resist this slow movement is what keeps the picture frame hanging.
A dynamic shear test provides a very different insight. A dynamic shear value (typically reported in pounds per square inch or kilopascals) provides insight into how a tape can resist a sudden shear force. An easy way to envision this is to think of a truck or utility trailer that has the side panels bonded to the framing system. A sudden wind gust or a shock of hitting a pothole in the road puts a strain on the tape that is short lived but very intense. It is common to see dynamic shear values on a data sheet for high performance bonding tapes such as 3M’s VHB acrylic foam tapes and similar competitive products.
 Tensile data can be reported in two ways depending on the tape being tested. For single faced tapes- particularly self-wound tapes such as duct tapes, masking tapes, electrical tapes, etc…, a tensile test is performed in a tensile testing machine where a specimen (usually 1” wide) is placed into the jaws and pulled apart at a specified rate. This data is typically reported in pounds per inch or Newtons per 25mm and provides useful insight into the strength of the backing material.
Tensile data can have a direct bearing on a tape’s ability to do certain jobs such as bundling where you might want to wrap or secure a number of things together. If the objects are heavy, you will typically need a tape with a higher tensile strength to keep the bundle intact without breaking.
You will often see elongation data presented along with the tensile test data. The elongation is a measurement of the increase in dimension expressed as a percentage before the actual breaking point. Having a tape with the ability to stretch or elongate is useful in certain application her the tape will need to bend around complex shapes or geometries without breaking.
The second type of tensile data is often referred to as ‘Z Tensile” or “Normal Tensile”. This type of data usually appears on data sheets for high performance foam bonding tapes.
Tensile data can be reported in two ways depending on the tape being tested. For single faced tapes- particularly self-wound tapes such as duct tapes, masking tapes, electrical tapes, etc…, a tensile test is performed in a tensile testing machine where a specimen (usually 1” wide) is placed into the jaws and pulled apart at a specified rate. This data is typically reported in pounds per inch or Newtons per 25mm and provides useful insight into the strength of the backing material.
Tensile data can have a direct bearing on a tape’s ability to do certain jobs such as bundling where you might want to wrap or secure a number of things together. If the objects are heavy, you will typically need a tape with a higher tensile strength to keep the bundle intact without breaking.
You will often see elongation data presented along with the tensile test data. The elongation is a measurement of the increase in dimension expressed as a percentage before the actual breaking point. Having a tape with the ability to stretch or elongate is useful in certain application her the tape will need to bend around complex shapes or geometries without breaking.
The second type of tensile data is often referred to as ‘Z Tensile” or “Normal Tensile”. This type of data usually appears on data sheets for high performance foam bonding tapes.
 In this type of test, two test blocks usually made from stainless steel or aluminum are bonded together with the tape and allowed to dwell for 72 hours. The blocks are mounted into a tensile testing machine and pulled apart a specified rate. The force to pull them apart is recorded and measured in pounds per square inch or kilopascals.
These values can be useful in understanding how well a tape can resist being pulled off of a surface. Think of the body side molding or emblems on a car. You wouldn’t want to be able to grab the emblem and just “pop” it off of the car. This data gives you some insight into the force required to do that.
In this type of test, two test blocks usually made from stainless steel or aluminum are bonded together with the tape and allowed to dwell for 72 hours. The blocks are mounted into a tensile testing machine and pulled apart a specified rate. The force to pull them apart is recorded and measured in pounds per square inch or kilopascals.
These values can be useful in understanding how well a tape can resist being pulled off of a surface. Think of the body side molding or emblems on a car. You wouldn’t want to be able to grab the emblem and just “pop” it off of the car. This data gives you some insight into the force required to do that.